
035. Partition Of Punjab in 1947
Some events in history have always fascinated me. One of them is the independence and partition of India in 1947. Besides the two World Wars, it can be counted among the most important events of the twentieth century. This event led to the independence of India, and eventually, three independent countries emerged.
The independence of India was not a simple affair, as it also involved the partition of the country. When it came to partition, it was actually the division of two provinces—Bengal and Punjab. I first developed an interest in this subject in the late 1980s when I was in school and studied the issue in Social Studies and Pakistan Studies textbooks. It was claimed that during the partition in 1947, the last Viceroy, Lord Mountbatten, conspired against Pakistan and influenced Radcliffe to award an unfair decision in India’s favor. However, the books provided no details about exactly how much area was allegedly awarded to India unfairly.
In the years that followed, I tried to find answers, but it proved to be a difficult task. There were no detailed maps available, nor any census data. However, I continued my search for more than two decades and eventually managed to find most of the pieces of this historical jigsaw puzzle.
My aim is not to stir controversy or to make any claim over “lost” territory. This is purely an academic exercise by a student of history. That is why I have tried to stick strictly to facts—whether census figures or geographical data. I do not claim that these are perfect maps created by a trained cartographer. I made them using simple tools like MS Paint, with the help of dozens of maps I found online and in books. However, they offer a reasonably fair representation of the demographics of Punjab in 1947. All readers are most welcome to point out any inaccuracies or suggest improvements.
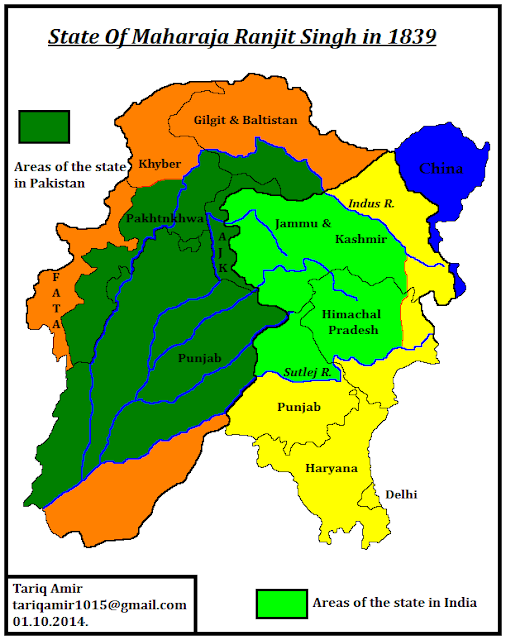
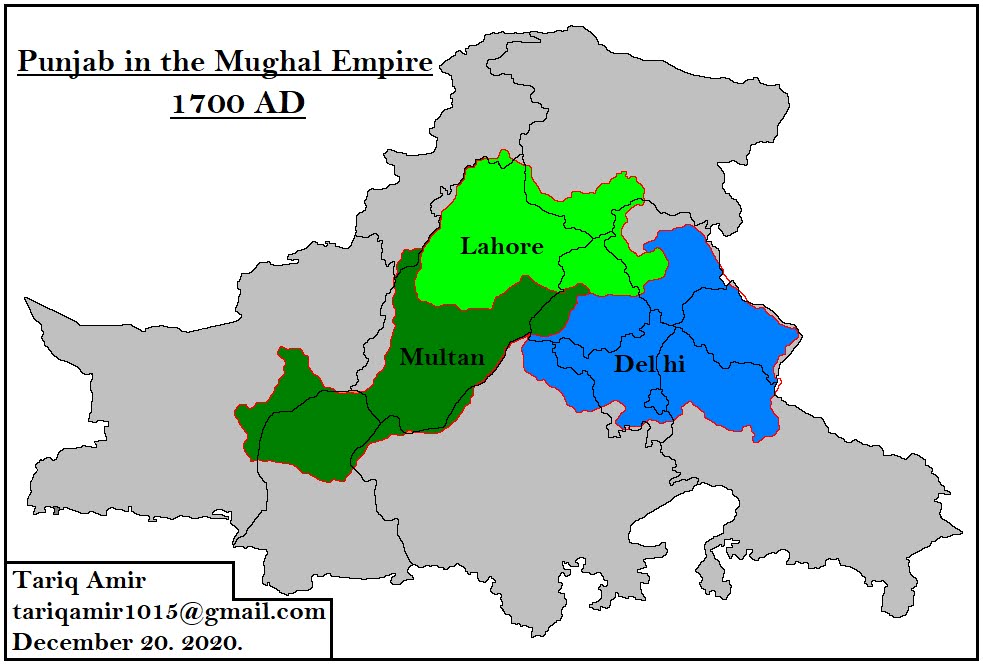
Before moving on to my main subject, I would like to give a brief historical background of the modern political boundaries of Punjab. After the disintegration of the Mughal Empire, Sikh power rose rapidly in central and eastern Punjab during the late 1750s. By 1763, they had even captured Lahore, the capital and most important city of Punjab. For the next four decades, chaos reigned, as the entire province became fragmented among dozens of petty Sikh and Muslim warlords and chieftains. Out of this situation, Ranjit Singh of Gujranwala emerged as a dominant force, capturing Lahore in 1799. By the time of his death in 1839, he had consolidated control over all of Punjab west of the Sutlej River, including the Bist Doab, most of present-day Pakistani Punjab (excluding the Bahawalpur Division), much of Khyber Pakhtunkhwa, and the Kashmir Valley.

The above map show the boundaries of the State of Maharaja Ranjit Singh in dark and light green colours. The areas marked with dark green lie in Pakistan, while areas in light green lie in present day India.
After the death of Maharaja Ranjit Singh, the Sikh state of Punjab became politically unstable. The British, as usual, were waiting for such an opportunity, and after several hard-fought battles during two wars, they finally conquered Punjab in 1849, the last independent state in India. From 1849 onward, Punjab became a province of British India.
In 1857, a mutiny broke out in the native regiments of the East India Company’s army, which soon spread over a large area. It was suppressed with great difficulty and much bloodshed. After the end of the mutiny, the British Crown assumed direct control of India, and several territories were reorganized. Delhi city and the surrounding districts between the Yamuna and Sutlej rivers were annexed to Punjab.
This arrangement remained in place until 1901, when the districts west of the Indus River were carved out of Punjab to form a new province known as the North-Western Frontier Province (NWFP).

The above map shows the boundaries of Punjab, after the annexation of Delhi and surrounding districts until the establishment of NWFP as a separate province in 1901.
After the establishment of NWFP in 1901, the next change in the boundaries of Punjab came in 1911, when the Government of British India decided to move the capital from Calcutta to Delhi. Following this shift, the former district of Delhi was separated from Punjab. Since then, Delhi has remained a federally administered area.
As mentioned above, after the Mutiny of 1857, a large area west of the Yamuna River was annexed to Punjab. However, most of this region was not inhabited by Punjabis. In fact, the majority of people in this area spoke a dialect of Hindi, known as Haryanvi. Approximately 80% of the population in the province of Punjab spoke various dialects of Punjabi, while the rest spoke Haryanvi.

The above match shows the linguistic division of Punjab. The red area is New Delhi, separated from Punjab in 1911 and declared as the new capital of British India.
India
during the British Raj, administratively was a very complicated place. Besides 11
clumsily formed provinces, it had about 565 princely states. Some of them were quite
large, but many were so small that it was difficult to represent them even on a very large scale map. Biggest of these was Hyderabad with an area of 214,187 sq. km.
But almost 200 states had an area of less than 25 sq. Km. Together these states
covered approximately one third of the total area of India and housed one
fourth of the total population. If that was not enough many of these were
divided into several non contiguous tracts of lands. British Raj controlled these
states as the Paramount Power, through its officers called residents.

The above map shows the provinces of British India and also the areas covered by the Princely States. In addition to that it also shows the religious demographics of India.
Punjab province was no exception in this regard. It also contained 34 princely states, besides
the areas directly administered by the British.

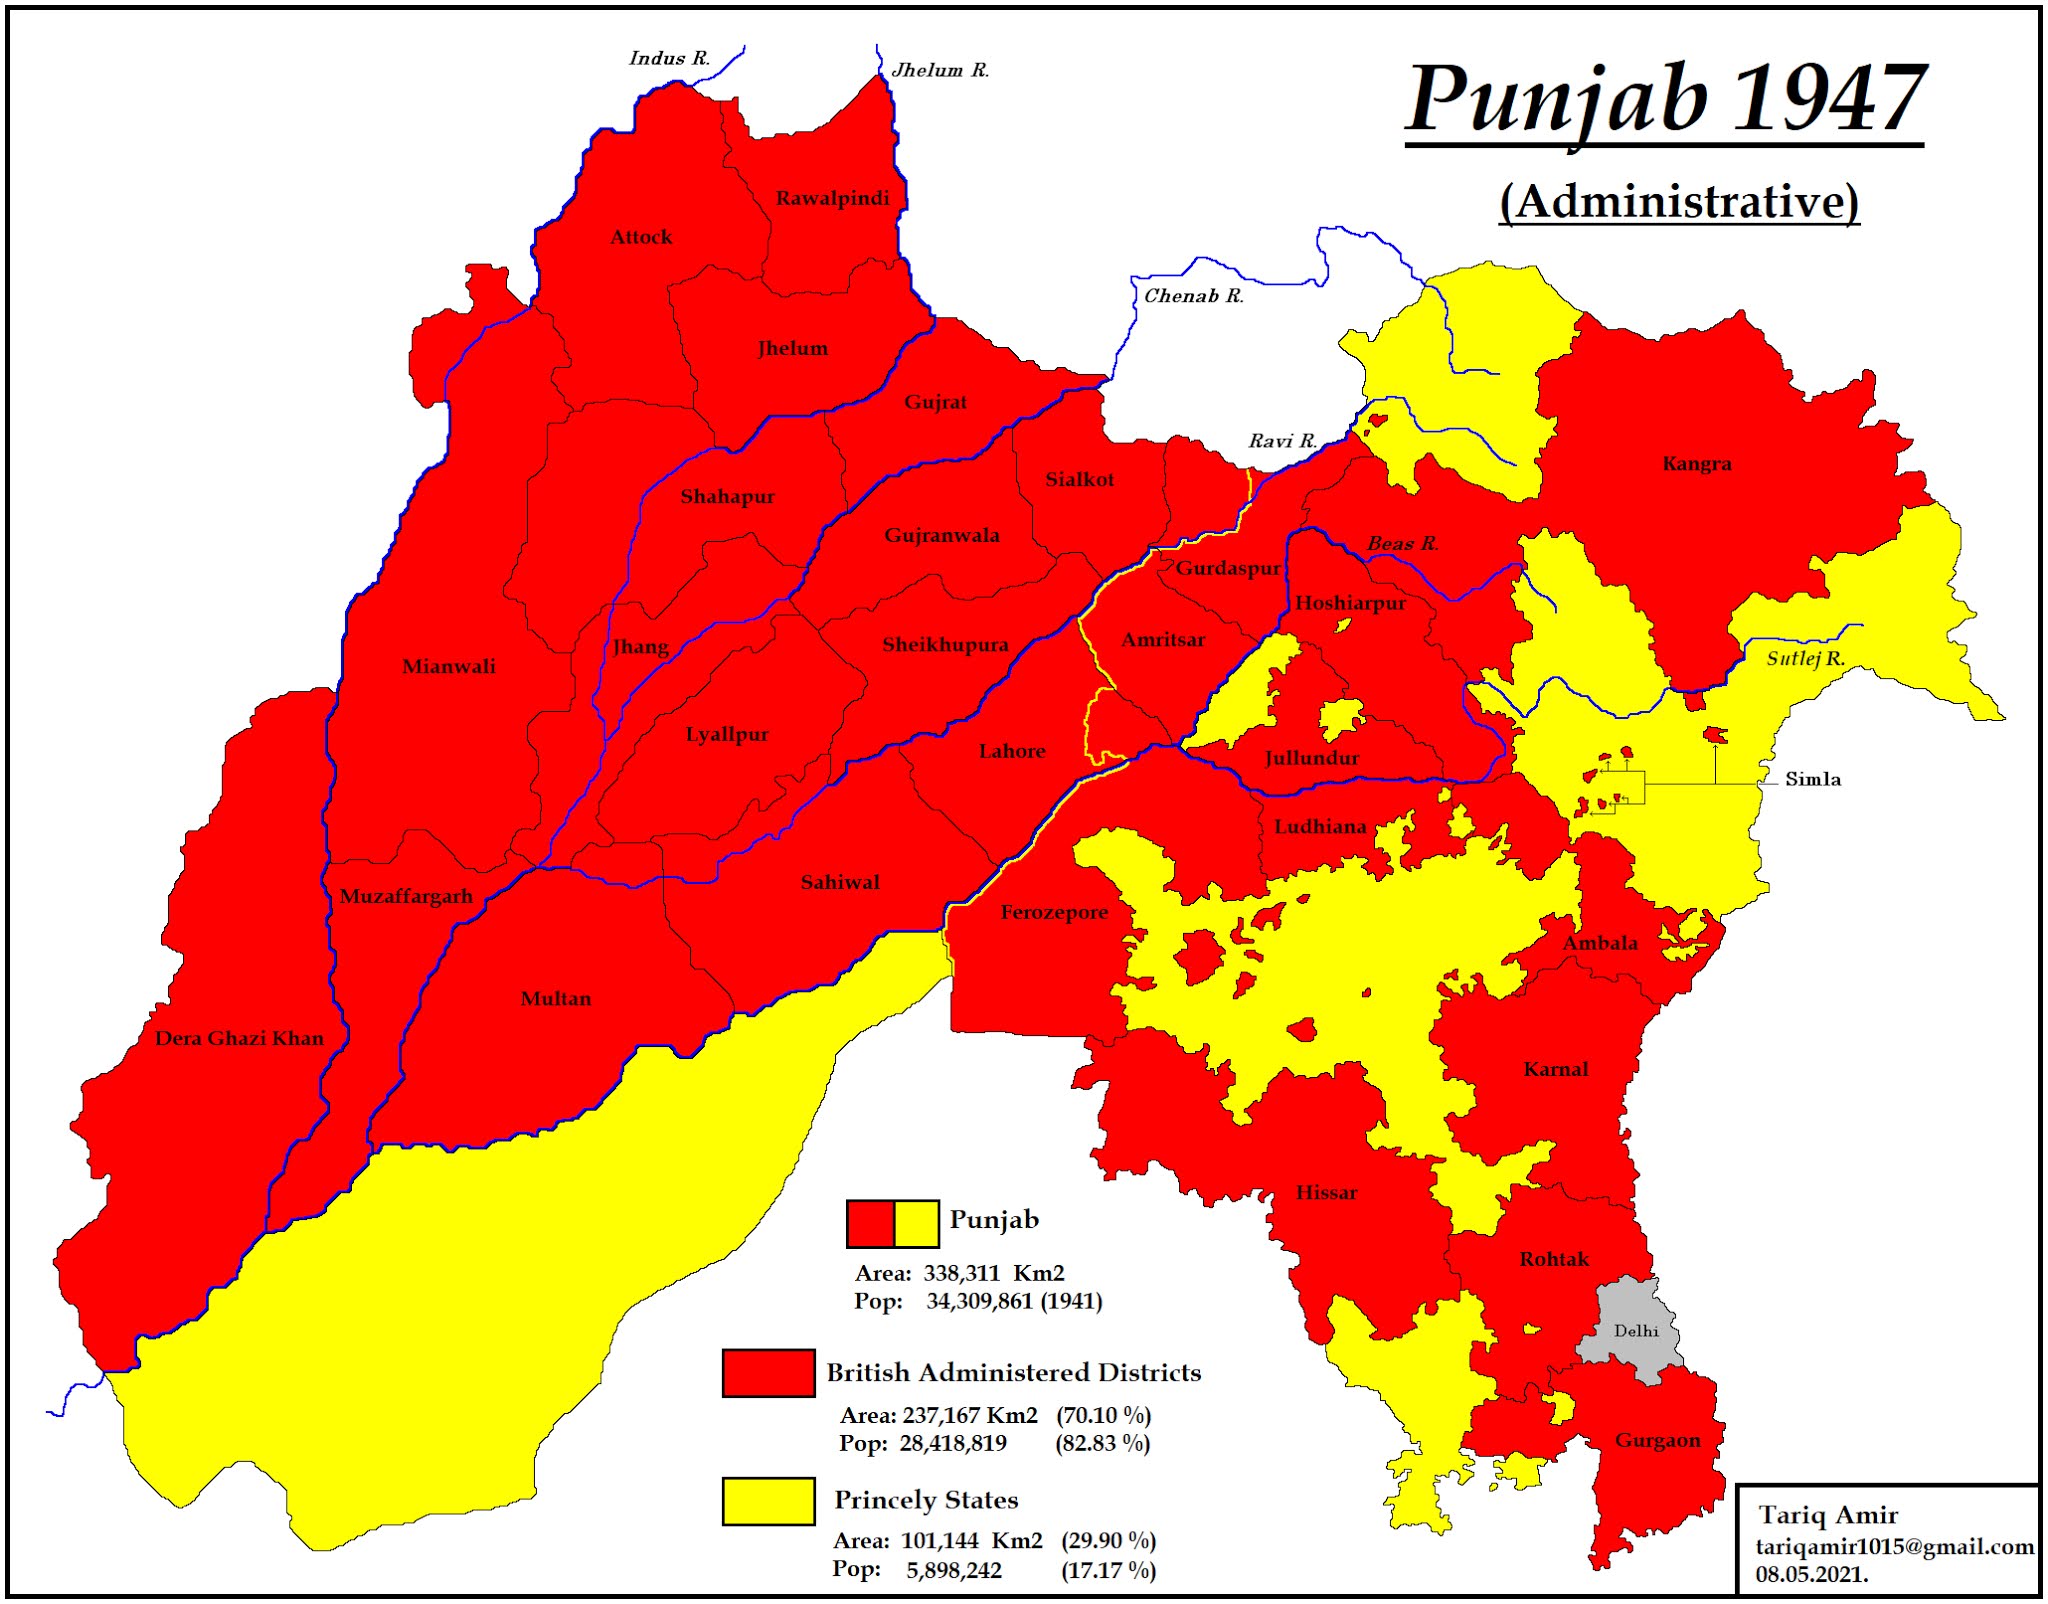
The above map shows the location of British Administered districts and the Princely States, also depicting the religion of the rulers of the states.

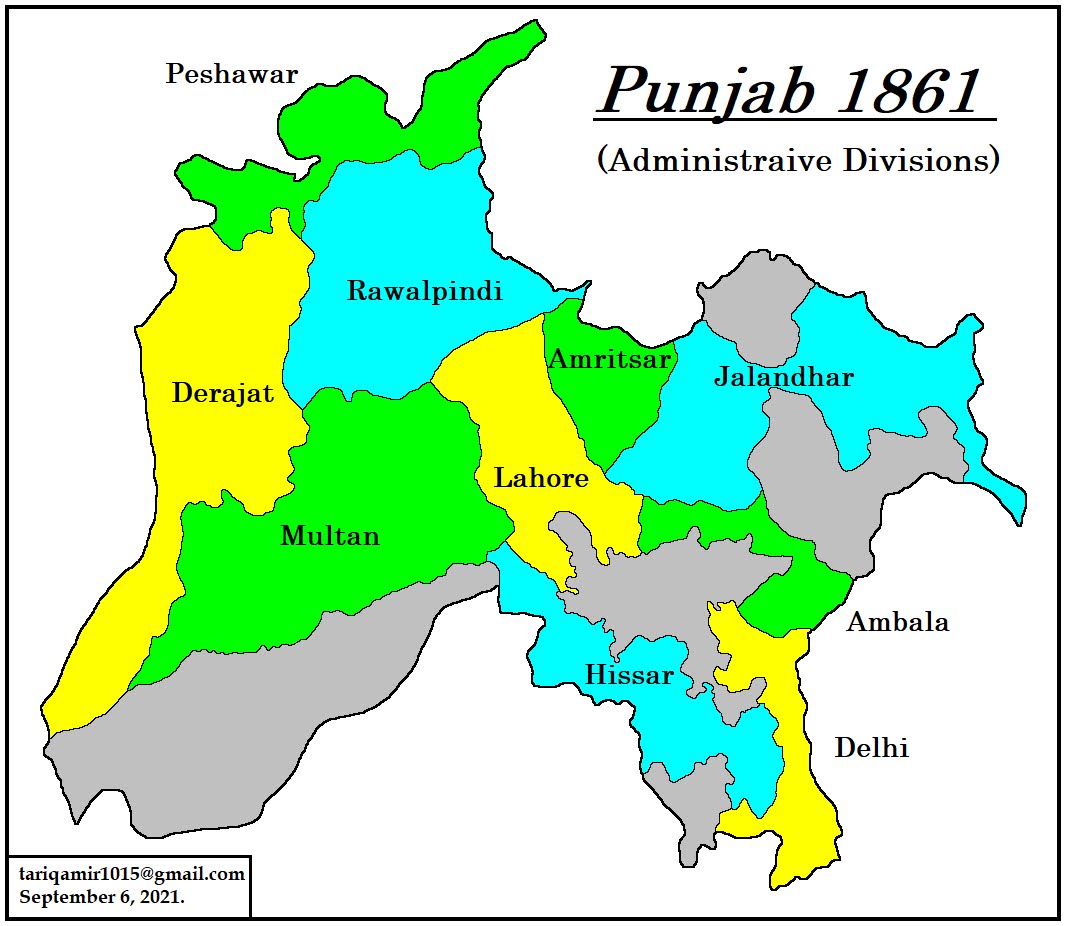
This map shows the five administrative divisions of Punjab and respective religious composition, according to the census of 1941.


The
population of Punjab rose rapidly during the fifty years between 1891 – 1941.
But this growth in western Punjab was much faster as compare to the eastern
Punjab. Reason for this can be explained by the fact that great projects of irrigation were completed in western Punjab and hence a great progress was made in agricultural field in this
region, and “canal colonies” were established.

The above map shows the population growth in Punjab from 1891 – 1941.
British administration had been undertaking census since 1881 regularly in India. The last census in the British Raj was conducted in 1941.

The above
map shows the population density of tehsils of Punjab, according to the
census of 1941.
The census of 1941 was very important, because this was the last
census of united India and on the basis of this census Punjab and Bengal were
partitioned between India and Pakistan. In the following set of maps you can
see the distribution of population according to their religions. I do not claim
these maps to be 100% correct, as boundaries of some princely states are not
clear, but these give you a fairly accurate picture.

The above map shows the percentage of Muslim population of Punjab in tehsils, according to the census of 1941.

The above map shows the simple distribution of Muslim population of Punjab, according to the census of 1941.
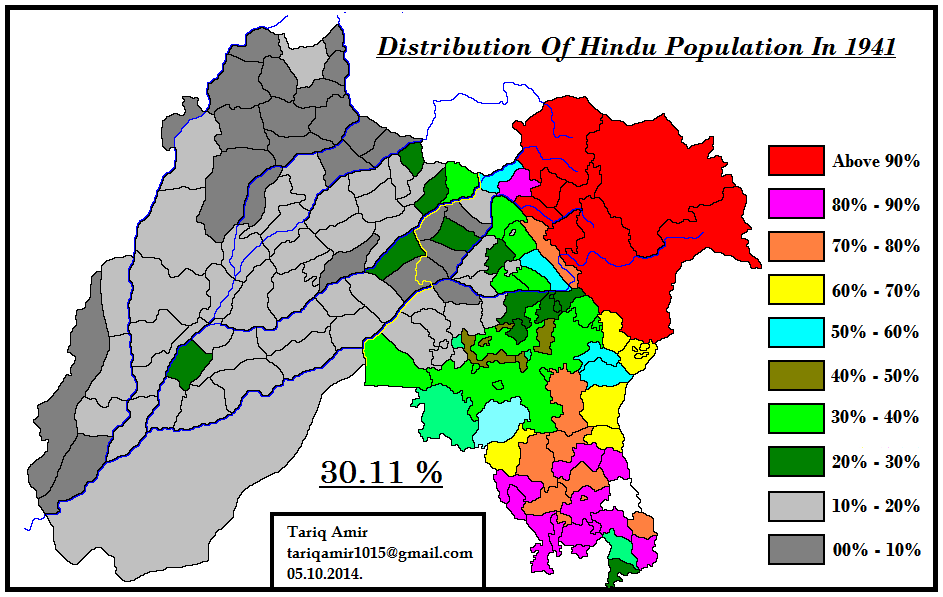
The above map shows the percentage of Hindu population of Punjab in tehsils, according to the census of 1941.

The above map shows the simple distribution of Hindu population of Punjab, according to the census of 1941.

The above map shows the percentage of Sikh population of Punjab in tehsils, according to the census of 1941.

The above map shows the simple distribution of Sikh population of Punjab, according to the census of 1941.

The above map shows the distribution of Christian population of Punjab, according to the census of 1941.
The last
map shows that most of the Christian population of Punjab was concentrated in
western Punjab. So when the question of the partition arose, they decided to
opt for Pakistan. They were just 1.44 % of the total population and were
insignificant in the total equation of Muslim and Hindu/Sikh population. But
there was one tehsil, that was Dasuya, where if they joined Muslims, the
balance turned in the favour of Muslims. In Dasuya Muslims were 48.35% and
Christians were 1.73%, so together they formed a majority of 50.08%.

In the above map you can see the claims of two parties. Red line shows the extent of Hindu/Sikh claim and green line shows the extent of Muslim/Christian claim.

In the map given above, I have further compared the territorial claims of both the parties.

Both parties presented some maps to support their respective claims. The above map was presented by the Muslim League to show some parts of tehsils where the Muslims were in majority.
When it
came clear that the partition was inevitable, the viceroy presented a Partition
Plan on June 3, 1947. According to this plan, Punjab was was divided in two
provinces of East Punjab and West Punjab. This partition was based on simple
district majorities of Muslims and non Muslims. The final partition was to be
dependent on the Radcliffe Award, so this division was called Notional Division.

The above map shows the Notional Division of Punjab based to district majorities of Muslims and non Muslims.
Sir Cyril Radcliffe was an English lawyer and was selected to head
the boundary commission to decide the border of Pakistan. The commission was set
up on 30 July and was given a deadline of 15 August, 1947, to announce its decision.
Muslims league nominated two Punjab High Court judges, Justice Din Muhammad and
Justice Muhammad Munir as the two members of this commission to fight its case.
While Justice Mehr Chand Mahajan and Justice Teja Singh represented Congress
and Sikhs, in this commission. Its terms of reference were defined as thus:
“The Boundary Commission is instructed to demarcate the
boundaries of the two parts of the Punjab on the basis of ascertaining the
contiguous majority areas of the Muslims and the non Muslims. In doing so it
will take into account other factors.”
The commission had a very difficult and complicated task to
accomplish in a very limited time and that’s too in a very charged atmosphere. It
failed to satisfy anyone. The whole process was kept secret and the award was
not published until 17th August, 1947. The map given below will help you in making an opinion of your own.
3.PNG)
The above map shows the distribution of population on the basis of religion in a greater detail. It shows Muslim/Christian majority tehsils and Hindu/Sikh majority tehsils. It also shows the 34 princely states of Punjab. Note that Muslims were in the majority in just two states, ie. Bahawalpur and Kapurthala. Kapurthala was however , ruled by a Sikh Maharaja. The yellow line represents the final decision of the boundary commission. Click the map for a larger view.

The above map shows that eventually how much area and population both parties got.

The above map shows the tehisl of Kausr, in Lahore district. It was the only tehsil which was divided and the larger part was given to India, despite having a clear Muslim/Christian majority. Now that part forms tehsil of Patti of district Taran Taran (ترن تارن)in Indian Punjab.
The table below gives the religious demographic details of the cities and towns with a population of more than 9 thousand, according to the census of 1941.
|
|
City |
Total |
Muslims |
% |
Hindus |
% |
Sikh |
% |
Christians |
% |
|
001 |
Hissar |
28,618 |
11116 |
38.84 |
15,921 |
55.63 |
390 |
1.36 |
166 |
0.58 |
|
002 |
Hansi |
22,590 |
10166 |
45.00 |
10,752 |
47.60 |
80 |
0.35 |
36 |
0.16 |
|
003 |
Bhiwani |
43,921 |
9316 |
21.21 |
33,774 |
76.90 |
360 |
0.82 |
160 |
0.36 |
|
004 |
Sirsa |
20,718 |
6368 |
30.74 |
13,083 |
63.15 |
831 |
4.01 |
72 |
0.35 |
|
005 |
Rohtak |
48,148 |
25129 |
52.19 |
20,458 |
42.49 |
315 |
0.65 |
63 |
0.13 |
|
006 |
Jhajhar |
13,919 |
7188 |
51.64 |
6,576 |
47.24 |
80 |
0.57 |
2 |
0.01 |
|
007 |
Meham |
11,145 |
6170 |
55.36 |
4,920 |
44.15 |
8 |
0.07 |
0 |
0.00 |
|
008 |
Sonipat |
17,781 |
8933 |
50.24 |
7,706 |
43.34 |
226 |
1.27 |
13 |
0.07 |
|
009 |
Hidayatpur |
9,945 |
3758 |
37.79 |
5,434 |
54.64 |
144 |
1.45 |
296 |
2.98 |
|
010 |
Palwal |
13,606 |
4404 |
32.37 |
8,831 |
64.91 |
30 |
0.22 |
244 |
1.79 |
|
011 |
Rewari |
30,673 |
15605 |
50.88 |
14,058 |
45.83 |
46 |
0.15 |
101 |
0.33 |
|
012 |
Karnal |
37,444 |
15844 |
42.31 |
20,462 |
54.65 |
647 |
1.73 |
125 |
0.33 |
|
013 |
Panipat |
37,837 |
28371 |
74.98 |
8,584 |
22.69 |
90 |
0.24 |
12 |
0.03 |
|
014 |
Kaithal |
22,325 |
10263 |
45.97 |
11,593 |
51.93 |
261 |
1.17 |
49 |
0.22 |
|
015 |
Shahabad |
14,745 |
10096 |
68.47 |
4,000 |
27.13 |
643 |
4.36 |
2 |
0.01 |
|
016 |
Ambala |
44,964 |
25913 |
57.63 |
16,040 |
35.67 |
1581 |
3.52 |
348 |
0.77 |
|
017 |
Ambala |
29,191 |
10431 |
35.73 |
14,768 |
50.59 |
2456 |
8.41 |
617 |
2.11 |
|
018 |
Kalka |
9,766 |
3129 |
32.04 |
5,766 |
59.04 |
660 |
6.76 |
71 |
0.73 |
|
019 |
Jagadhri |
16,422 |
4958 |
30.19 |
10,906 |
66.41 |
208 |
1.27 |
180 |
1.10 |
|
020 |
Rupar |
10,385 |
5300 |
51.04 |
3,354 |
32.30 |
1262 |
12.15 |
158 |
1.52 |
|
021 |
Simla |
18,348 |
5651 |
30.80 |
11,173 |
60.89 |
751 |
4.09 |
349 |
1.90 |
|
022 |
Dharmsala |
9,653 |
1294 |
13.41 |
8,024 |
83.12 |
229 |
2.37 |
62 |
0.64 |
|
023 |
Hoshiarpur |
35,345 |
16834 |
47.63 |
15,478 |
43.79 |
2242 |
6.34 |
252 |
0.71 |
|
024 |
Dasuya |
9,206 |
6595 |
71.64 |
2,400 |
26.07 |
163 |
1.77 |
44 |
0.48 |
|
025 |
Urmar |
12,734 |
8,037 |
63.11 |
3,687 |
28.95 |
797 |
6.26 |
51 |
0.40 |
|
026 |
Jullundur |
135,283 |
80,242 |
59.31 |
48375 |
35.76 |
4,676 |
3.46 |
977 |
0.72 |
|
027 |
Kartarpur |
12,150 |
4,522 |
37.22 |
6362 |
52.36 |
1,250 |
10.29 |
16 |
0.13 |
|
028 |
Nawanshahr |
10,275 |
2,950 |
28.71 |
6552 |
63.77 |
689 |
6.71 |
1 |
0.01 |
|
029 |
Banga |
9,112 |
1,976 |
21.69 |
4832 |
53.03 |
1,949 |
21.39 |
4 |
0.04 |
|
030 |
Phillaur |
9,011 |
4,918 |
54.58 |
3574 |
39.66 |
479 |
5.32 |
34 |
0.38 |
|
031 |
Nakodar |
10,981 |
5,322 |
48.47 |
4385 |
39.93 |
358 |
3.26 |
– |
0.00 |
|
032 |
Ludhiana |
111,639 |
70,182 |
62.87 |
34704 |
31.09 |
5,273 |
4.72 |
596 |
0.53 |
|
033 |
Jagraon |
26,704 |
14,004 |
52.44 |
9341 |
34.98 |
3,096 |
11.59 |
72 |
0.27 |
|
034 |
Raikot |
13,777 |
9,344 |
67.82 |
3063 |
22.23 |
892 |
6.47 |
– |
0.00 |
|
035 |
Ferozepore |
82,502 |
38,390 |
46.53 |
34543 |
41.87 |
6,457 |
7.83 |
900 |
1.09 |
|
036 |
Moga |
27,785 |
7,016 |
25.25 |
11,790 |
42.43 |
8,477 |
30.51 |
490 |
1.76 |
|
037 |
Muktsar |
20,651 |
5,340 |
25.86 |
10,015 |
48.50 |
5,121 |
24.80 |
31 |
0.15 |
|
038 |
Fazilka |
28,262 |
8,246 |
29.18 |
18,771 |
66.42 |
1,107 |
3.92 |
25 |
0.09 |
|
039 |
Abohar |
21,222 |
5216 |
24.58 |
14,980 |
70.59 |
846 |
3.99 |
59 |
0.28 |
|
040 |
Lahore |
671,659 |
433,170 |
64.49 |
179,422 |
26.71 |
34,021 |
5.07 |
21,495 |
3.20 |
|
041 |
Chunian |
10,093 |
5,292 |
52.43 |
4,329 |
42.89 |
472 |
4.68 |
– |
0.00 |
|
042 |
Mandi |
1,114 |
2,641 |
23.76 |
6,227 |
56.03 |
2,083 |
18.74 |
163 |
1.47 |
|
043 |
Kasur |
53,101 |
39,295 |
74.00 |
10,752 |
20.25 |
2,034 |
3.83 |
562 |
1.06 |
|
044 |
Patti |
17,595 |
12,879 |
73.20 |
2,823 |
16.04 |
1,495 |
8.50 |
37 |
0.21 |
|
045 |
Amritsar |
391,010 |
184,055 |
47.07 |
144,522 |
36.96 |
58,769 |
15.03 |
2,611 |
0.67 |
|
046 |
Jandiala |
11,520 |
6,893 |
59.84 |
2,691 |
23.36 |
1,004 |
8.72 |
75 |
0.65 |
|
047 |
Majitha |
9,004 |
5,200 |
57.75 |
2,061 |
22.89 |
1,655 |
18.38 |
38 |
0.42 |
|
048 |
Tarn |
16,607 |
7,006 |
42.19 |
3,796 |
22.86 |
5,520 |
33.24 |
279 |
1.68 |
|
049 |
Gurdaspur |
6,641 |
8,263 |
49.65 |
5,920 |
35.57 |
1,711 |
10.28 |
721 |
4.33 |
|
050 |
Batala |
44,458 |
29,859 |
67.16 |
12,043 |
27.09 |
2,109 |
4.74 |
446 |
1.00 |
|
051 |
Pathankot |
12,354 |
6,716 |
54.36 |
4,833 |
39.12 |
406 |
3.29 |
379 |
3.07 |
|
052 |
Sialkot |
138,708 |
90,706 |
65.39 |
29,662 |
21.38 |
8,431 |
6.08 |
5,157 |
3.72 |
|
053 |
Pasrur |
10,523 |
7,586 |
72.09 |
1,937 |
18.41 |
205 |
1.95 |
689 |
6.55 |
|
054 |
Narowal |
12,021 |
6,759 |
56.23 |
2,863 |
23.82 |
1,301 |
10.82 |
854 |
7.10 |
|
055 |
Daska |
13,719 |
7,394 |
53.90 |
3,279 |
23.90 |
2,249 |
16.39 |
719 |
5.24 |
|
056 |
Gujranwala |
84,545 |
45,904 |
54.30 |
24,378 |
28.83 |
11016 |
13.03 |
1,893 |
2.24 |
|
057 |
Kamonki |
11,602 |
3,575 |
30.81 |
5,177 |
44.62 |
2445 |
21.07 |
405 |
3.49 |
|
058 |
Wazirabad |
27,079 |
19,132 |
70.65 |
5,739 |
21.19 |
1359 |
5.02 |
845 |
3.12 |
|
059 |
Hafizabad |
17,093 |
9,727 |
56.91 |
5,660 |
33.11 |
1080 |
6.32 |
610 |
3.57 |
|
060 |
Sheikhupura |
22,272 |
10,755 |
48.29 |
7,070 |
31.74 |
3609 |
16.20 |
829 |
3.72 |
|
061 |
Nankana |
12,981 |
2,900 |
22.34 |
4,440 |
34.20 |
5427 |
41.81 |
206 |
1.59 |
|
062 |
Gujrat |
30,899 |
24,681 |
79.88 |
5,011 |
16.22 |
630 |
2.04 |
553 |
1.79 |
|
063 |
Jalalpur |
16,663 |
12,779 |
76.69 |
3,524 |
21.15 |
149 |
0.89 |
211 |
1.27 |
|
064 |
Lala |
12,163 |
6,484 |
53.31 |
3,615 |
29.72 |
1833 |
15.07 |
231 |
1.90 |
|
065 |
M. Bahauddin |
12,752 |
2,269 |
17.79 |
6,146 |
48.20 |
4277 |
33.54 |
61 |
0.48 |
|
066 |
Khushab |
17,141 |
13,609 |
79.39 |
3,044 |
17.76 |
479 |
2.79 |
7 |
0.04 |
|
067 |
Bhera |
20,219 |
15,489 |
76.61 |
4,388 |
21.70 |
335 |
1.66 |
6 |
0.03 |
|
068 |
Sargodha |
36,420 |
12,060 |
33.11 |
7,405 |
47.79 |
5920 |
16.25 |
998 |
2.74 |
|
069 |
Jhelum |
33,191 |
19,416 |
58.50 |
8,936 |
26.92 |
3950 |
11.90 |
619 |
1.86 |
|
070 |
P. Dadan Khan |
11,445 |
7,803 |
68.18 |
3,318 |
28.99 |
305 |
2.66 |
6 |
0.05 |
|
071 |
Chakwal |
11,835 |
6,684 |
56.48 |
2,799 |
23.65 |
2388 |
20.18 |
40 |
0.34 |
|
072 |
Rawalpindi |
185,042 |
81,038 |
43.79 |
62,393 |
33.72 |
32054 |
17.32 |
3,668 |
1.98 |
|
073 |
Cambellpur |
13,999 |
7,408 |
52.92 |
4,312 |
30.80 |
2031 |
14.51 |
223 |
1.59 |
|
074 |
Hazro |
11,186 |
7,411 |
66.25 |
2,752 |
24.60 |
1013 |
9.06 |
10 |
0.09 |
|
075 |
Pindigheb |
12,641 |
8,708 |
68.89 |
3,007 |
23.79 |
924 |
7.31 |
2 |
0.02 |
|
076 |
Mianwali |
22,825 |
13,041 |
57.13 |
8,940 |
39.17 |
633 |
2.77 |
210 |
0.92 |
|
077 |
Bhakkar |
9,006 |
4,060 |
45.08 |
2,712 |
30.11 |
173 |
1.92 |
18 |
0.20 |
|
078 |
Montgomery |
38,345 |
14,860 |
38.75 |
17,435 |
45.47 |
5,254 |
13.70 |
746 |
1.95 |
|
079 |
Okara |
19,315 |
5,216 |
27.00 |
10,378 |
53.73 |
3,113 |
16.12 |
601 |
3.11 |
|
080 |
Pakpattan |
17,852 |
9,516 |
53.30 |
7,432 |
41.63 |
839 |
4.70 |
55 |
0.31 |
|
081 |
Lyallpur |
69,930 |
23,003 |
32.89 |
32,896 |
47.04 |
10,897 |
15.58 |
3,027 |
4.33 |
|
082 |
Gojra |
12,964 |
3,253 |
25.09 |
6,891 |
53.15 |
1,302 |
10.04 |
1,167 |
9.00 |
|
083 |
Kamalia |
14,295 |
6,011 |
42.05 |
6,906 |
48.31 |
1,459 |
10.21 |
75 |
0.52 |
|
084 |
Jaranwala |
9,833 |
2,534 |
25.77 |
5,693 |
57.90 |
2,215 |
22.53 |
67 |
0.68 |
|
085 |
Jhang |
50,051 |
24,506 |
48.96 |
23,246 |
46.44 |
217 |
0.43 |
39 |
0.08 |
|
086 |
Chiniot |
34,437 |
23,050 |
66.93 |
11,158 |
32.40 |
58 |
0.17 |
12 |
0.03 |
|
087 |
Multan |
142,768 |
81,393 |
57.01 |
56,477 |
39.56 |
2,665 |
1.87 |
680 |
0.48 |
|
088 |
Kahror |
11,348 |
4,620 |
40.71 |
6,701 |
59.05 |
26 |
0.23 |
– |
0.00 |
|
089 |
Khanewal |
17,036 |
5,710 |
33.52 |
9,283 |
54.49 |
1,664 |
9.77 |
278 |
1.63 |
|
090 |
Leiah |
13,087 |
7,372 |
56.33 |
5,683 |
43.42 |
28 |
0.21 |
4 |
0.03 |
|
091 |
D. Ghazi Khan |
32,139 |
18,810 |
58.53 |
12,989 |
40.42 |
157 |
0.49 |
37 |
0.12 |
|
092 |
Jampur |
11,862 |
7,975 |
67.23 |
2,260 |
19.05 |
24 |
0.20 |
3 |
0.03 |
|
093 |
Mandi |
9,033 |
333 |
3.69 |
8,218 |
90.98 |
141 |
1.56 |
|
0.00 |
|
094 |
Kapurthala |
26,067 |
15,093 |
57.90 |
8,968 |
34.40 |
1,594 |
6.12 |
20 |
0.08 |
|
095 |
Sultanpur |
10,168 |
6,203 |
61.01 |
3,394 |
33.38 |
470 |
4.62 |
– |
0.00 |
|
096 |
Phagwara |
16,194 |
4,724 |
29.17 |
8,256 |
50.98 |
2,355 |
14.54 |
11 |
0.07 |
|
097 |
Maler |
29,321 |
22,296 |
76.04 |
6,270 |
21.38 |
456 |
1.56 |
39 |
0.13 |
|
098 |
Faridkot |
20,375 |
10,228 |
50.20 |
4,742 |
23.27 |
4,608 |
22.62 |
50 |
0.25 |
|
099 |
Kot |
20,584 |
8,107 |
39.38 |
7,280 |
35.37 |
5,154 |
25.04 |
35 |
0.17 |
|
100 |
Patiala |
69,850 |
26,116 |
37.39 |
27,361 |
39.17 |
5,894 |
22.75 |
|
0.00 |
|
101 |
Bassi |
14,400 |
9,742 |
67.65 |
3,978 |
27.63 |
680 |
4.72 |
– |
0.00 |
|
102 |
Samana |
14,912 |
11,037 |
74.01 |
3,701 |
24.82 |
130 |
0.87 |
3 |
0.02 |
|
103 |
Sunam |
14,187 |
5,329 |
37.56 |
5,166 |
36.41 |
3,439 |
24.24 |
17 |
0.12 |
|
104 |
Barnala |
12,341 |
2,848 |
23.08 |
4,734 |
38.36 |
4,688 |
37.99 |
6 |
0.05 |
|
105 |
Bhatinda |
24,833 |
8,431 |
33.95 |
9,828 |
39.58 |
5,645 |
22.73 |
|
0.00 |
|
106 |
Narnaul |
23,063 |
9,750 |
42.28 |
8,080 |
35.03 |
81 |
0.35 |
2 |
0.01 |
|
107 |
Mohindargarh |
9,771 |
4,492 |
45.97 |
5,180 |
53.01 |
98 |
1.00 |
1 |
0.01 |
|
108 |
Sangur |
17,132 |
3,182 |
18.57 |
8,211 |
47.93 |
3,198 |
18.67 |
59 |
0.34 |
|
109 |
Jind |
14,909 |
4,934 |
33.09 |
9,326 |
62.55 |
256 |
1.72 |
22 |
0.15 |
|
110 |
Nabha |
22,625 |
8,942 |
39.52 |
9,735 |
43.03 |
2,307 |
10.20 |
12 |
0.05 |
|
111 |
Phul |
9,515 |
1,480 |
15.55 |
5,854 |
61.52 |
1,324 |
13.91 |
7 |
0.07 |
|
112 |
Jaitu |
11,435 |
2,450 |
21.43 |
5,776 |
50.51 |
3,174 |
27.76 |
|
0.00 |
|
113 |
Dhanaula |
9,560 |
3,244 |
33.93 |
2,356 |
24.64 |
3,960 |
41.42 |
– |
0.00 |
|
114 |
Bahwalpur |
40,015 |
28,946 |
72.34 |
10,836 |
27.08 |
208 |
0.52 |
25 |
0.06 |
|
115 |
Ahmadpur |
12,255 |
6,920 |
56.47 |
5,303 |
43.27 |
32 |
0.26 |
– |
0.00 |
While
doing my research I noted many points that startled me, and I felt that the
allegations of unfair award of the boundary commission and favouring India on
this account have solid grounds.
1. Eight Muslim/Christian majority tehsils that were contiguous to Pakistan
were given to India, on the pretext of “other factors”.
2. Not a single non Muslim majority tehsil was given to Pakistan.
3. A large part of Kausr tehsil was awarded to India on the flimsy
ground of protecting Amritsar city.
4. Due to the above-mentioned reasons, the state of Kapurthala, with a clear
Muslim majority and surrounded by Muslim majority tehsils, fell into India.
|
Tehsil |
ArKm2 |
Population |
Muslims |
% |
Hindus |
% |
Sikhs |
% |
Christians |
% |
|
Dasuya |
1,298 |
273,246 |
132,105 |
48.35 |
95,572 |
34.98 |
40,509 |
14.83 |
4,729 |
1.7 |
|
Jullundur |
1,008 |
443,010 |
226,623 |
51.16 |
123,718 |
27.93 |
86,996 |
19.64 |
4,656 |
1.05 |
|
Nakodar |
945 |
228,783 |
135,918 |
59.41 |
39,766 |
17.38 |
52,037 |
22.75 |
929 |
0.41 |
|
Ferozepore |
1,761 |
290,286 |
160,371 |
55.25 |
53,520 |
18.44 |
70,782 |
24.38 |
3,847 |
1.33 |
|
Zira |
1,279 |
210,819 |
137,586 |
65.26 |
18,863 |
8.95 |
50,209 |
23.82 |
3,801 |
1.80 |
|
Ajnala |
1,083 |
237,049 |
140,939 |
59.46 |
15,415 |
6.50 |
67,986 |
28.68 |
12,708 |
5.36 |
|
Gurdaspur |
1,287 |
328,819 |
171,498 |
52.16 |
57,281 |
17.42 |
76,695 |
23.32 |
22,506 |
6.84 |
|
Batala |
1,235 |
380,053 |
209,277 |
55.07 |
33,610 |
8.84 |
116,413 |
30.63 |
20,670 |
5.44 |
|
Kapurthala |
1,712 |
378,380 |
213,754 |
56.49 |
61,546 |
16.27 |
88,350 |
23.35 |
1,643 |
0.43 |
|
|
|
|
|
|
|
|
|
|
|
|
|
Total |
11,608 |
2,770,445 |
1,528,071 |
55.16 |
499,291 |
18.02 |
649,977 |
23.46 |
75,489 |
2.72 |
The above table clearly
shows that in these 9 units, Muslims/Christians had a clear majority of
57.88%, against Hindus/Sikhs population of 41.5%. But the question arises that
in case all these tehsils were awarded to Pakistan, two non Muslim majority
tehsils of Amritsar and Taran Taran would have formed an enclave inside
Pakistan. First, these two tehsils were not contiguous to other non Muslim
areas. Second, even if they had fallen in Pakistan, the Muslim population was
so large, that the whole block (consider the above area as Block A) would have still retained Muslim majority. As
the table below shows:
|
Tehsil |
ArKm2 |
Population |
Muslims |
% |
Hindus |
% |
Sikhs |
% |
Christians |
% |
|
Block A |
11,608 |
2,770,380 |
1,528,071 |
55.16 |
499,291 |
18.02 |
649,977 |
23.46 |
75,489 |
2.72 |
|
Amritsar |
1,414 |
789,159 |
359,025 |
45.49 |
175,771 |
22.27 |
243,297 |
30.83 |
8,948 |
1.14 |
|
Taran Taran |
1,546 |
387,668 |
157,731 |
40.69 |
26,245 |
6.77 |
199,562 |
51.48 |
3,654 |
0.94 |
|
Total |
14,658 |
3,947,207 |
2,044,827 |
51.80 |
701,307 |
17.77 |
1,092,836 |
27.69 |
88,091 |
2.23 |
There is one more point worth noting that the tehsil Ferozepore consisted of two non-contiguous parts. It had an enclave of Nathana, which was a considerable area. In 1959, it was transferred to the district of Bathinda. Nathana and the surrounding areas were predominantly non Muslims. I don’t have figures for these two parts (Ferozepore & Nathana) separately, but I am sure that if we take the figures of Ferozepore proper only, the Muslim majority in this area must had been greater than 55.25%, which is for the whole tehsil, like neighbouring Zira (65.26%), or even more.

There as another point
which caught my attention is that Sikhs tried to to portray themselves as
the worst victims of this partition which cut their community into two halves.
They still stress upon this point. But that is not the truth. Here too Muslims
were the worst effected, as the figures given below show:
|
|
Muslims |
% |
Hindus |
% |
Sikhs |
% |
Christians |
% |
|
Falling in Pakistan |
12,600,912 |
69.71 |
2,307,435 |
22.39 |
1,365,288 |
26.90 |
340,860 |
72.54 |
|
Falling in India |
5,474,625 |
30.29 |
7,995,952 |
77.61 |
3,709,518 |
73.10 |
129,053 |
27.46 |
So of all the communities, Muslims had the highest percentage to fall on the wrong side of the new border. Actually this
misunderstanding on the part of Sikhs is probably due to the fact that while calculating their population, they take figures of population of only the British-administered areas and
ignore the population living in the princely states, where a large proportion
of Sikhs lived.
|
|
Muslims |
% |
Hindus |
% |
Sikhs |
% |
Christians |
% |
|
The whole Punjab |
18,259,744 |
53.22 |
10,336,549 |
30.13 |
5,115,185 |
14.91 |
493,081 |
1.44 |
|
British |
16,217,242 |
57.07 |
7,894,087 |
27.78 |
3,757,401, |
13.22 |
486,038 |
1.71 |
|
Princely States |
2,042,744 |
34.67 |
2,442,942 |
41.46 |
1,358,784 |
23.07 |
7,043 |
0.12 |
As I mentioned above a large part in the eastern Punjab and the Himalayan mountains was populated by Hindi/Urdu speaking people. Which were about 20 per cent of the total population of Punjab. The following table shows the religious composition based on the language spoken by the people.
|
|
Muslims |
% |
Hindus |
% |
Sikhs |
% |
Christians |
% |
|
The whole Punjab |
18,259,744 |
53.22 |
10,336,549 |
30.13 |
5,115,185 |
14.91 |
493,083 |
1.44 |
|
Punjabi Speaking |
16,827,041 |
61.97 |
4,841,874 |
17.83 |
4,916,950 |
18.11 |
485,292 |
1.79 |
|
Hindi/Urdu Speak. |
1,432,708 |
20.00 |
5,490,353 |
76.63 |
199,234 |
2.78 |
8,789 |
0.12 |
The above given table shows a very interesting fact that 62% of the Punjabi nation were Muslim according to the census of 1941, while Sikhs and Hindus were almost equal, with Sikhs slightly larger percentage.
After doing all this research, collecting data and making maps, I kept on thinking that what should have been a more just and fair award? Or what would have been my decision? So I came up with the following map:

If I were to decide the partition, I would have allocated some additional areas to Pakistan, shaded in light blue.
The basic rationale behind this proposal is to give Amritsar, being the holiest place for Sikhs, to India. While giving most of the Muslim majority areas to Pakistan, including some other areas in lieu of the Muslim majority areas in Bist Doab. This additional territory I have marked with light blue colour.
You are most welcome to give your own suggestions, of course with reasons and arguments. I shall put them on this blog with your name and place. Sure this invitation is to my friends on the “other side” of the Radcliffe Line as well. Similarly, I shall appreciate your suggestions to improve this article further or point out any inaccuracies.
Tariq Amir
23 October, 2014.
Doha – Qatar
Came across this most excellent resource on the Partition of Punjab. Great work, especially with the detailed maps. It would be greatly appreciated if you could cite all sources used for the tables, maps and other data.
The partition of Punjab was a Sikh demand, a corollary to the Muslim League’s demand for the partition of India. Amritsar is their holiest place, and going by the Muslim majorities in the various tehsils would have had it surrounded on 3 sides (going by your suggestion) or all sides (as you rightly point out). This would’ve led to the Sikhs living under permanent insecurity – which wouldn’t be acceptable to the Sikhs – and likely would’ve lead to war. In any case, a lot of blood was nonetheless shed mercilessly, with nearly a million lives lost and over ten million uprooted one of the greatest tragedies of the 20th century.
There was also the case of the integrity of the Upper Bari Doab Canal system which would have further threatened Amritsar.
Many details about the decision are mentioned in _Borders and conflict in South Asia: The Radcliffe Boundary Commission and the partition of Punjab_ by Lucy Chester.
Thank you for your comments. For the population data I used the Census Report of 1941. For maps, I used a few different maps available on the net and some other maps published along with the proceedings of boundary commission titled “Partition of Punjab 1947”, published by Sang-e-Meel Publications.
As per the article the “The boundary commission was set up on 30 July and was given a deadline of 15 August, 1947”
But Sir Cyril Radcliffe was appointed chairman of both the Punjab and Bengal boundary commissions in June 1947. Although his formal appointment was made that month following the announcement of the partition plan on June 3, 1947, he arrived in India on July 8, 1947, to begin the boundary demarcation process
I have read some just right stuff here. Certainly value bookmarking for revisiting. I wonder how much effort you set to create one of these fantastic informative website.