133. Demographics of Balochistan Province According to the Census of 1941 (Religions)
Balochistan (also spelled Baluchistan during the British Raj) was the farthest corner of the British Empire in India in every sense of the word. It was sparsely populated, far from the main centres of population, and located on the extreme western borders of India. The British began taking an interest in this area in the late 1830s. At that time, the East India Company had already subdued almost all of present-day India, with only Sindh and Punjab remaining outside its direct influence.
In 1839, the EIC, in collaboration with the Punjab state under Maharaja Ranjit Singh, planned to install the deposed King Shah Shuja on the throne of Kabul, replacing Dost Muhammad Khan. According to the plan, the joint forces were to assemble at Shikarpur in Sindh and then march towards Kandahar via the Bolan Pass. During this campaign, British forces occupied the Bolan Pass and the surrounding areas, including Quetta and Chaman. Kandahar fell, and later Kabul was also captured.
This campaign marked the first time the strategic importance of Quetta was recognized by the British, and a cantonment was later established there, around which the city eventually developed. However, the invasion of 1839, known as the First Anglo-Afghan War, ended in a disastrous retreat three years later, in 1842. Shortly afterward, Afghanistan and the other occupied areas, including Quetta, were abandoned. Nonetheless, during this period, an expedition from Quetta conquered Kalat, and the state—which had hitherto been under Afghan suzerainty—was forced to recognize British India as the paramount power.
The 1840s brought dramatic changes to the political landscape of present-day Pakistan. Sindh was annexed by the East India Company in 1843, and soon after, in 1846, Punjab was defeated and fully annexed in 1849. By this time, all the major provinces were under British control, but the western frontiers of this vast empire were still not clearly defined, a process that would take several more decades to complete. In 1854, the treaty of 1839 was renewed, and Kalat once again accepted the suzerainty of the British government in Delhi. The next milestone came in 1876, when the British permanently occupied Quetta and extended their influence over the state of Kalat, assuming responsibility for both internal and external security.
During this period, the British steadily increased their control over the districts of Loralai, Zhob, and Sibi through a combination of force and diplomacy, gradually bringing the local tribes to recognize British paramountcy. The outbreak of the Second Anglo-Afghan War in 1878 further strengthened British control in the region. At the conclusion of the war, the Treaty of Gandamak was signed in May 1879, in which Yaqub Khan, the king of Afghanistan, formally ceded the districts of Pishin, Quetta, Loralai, Sibi, and Zhob to the British. Meanwhile, Balochistan’s western border with Iran was formally settled in 1871.
This is how the British gradually acquired the territories that today constitute the Pakistani province of Balochistan. I shall not delve further into its earlier history, as the focus of this post is the religious demographics of Balochistan in 1941, the last census conducted before the partition of India in 1947.

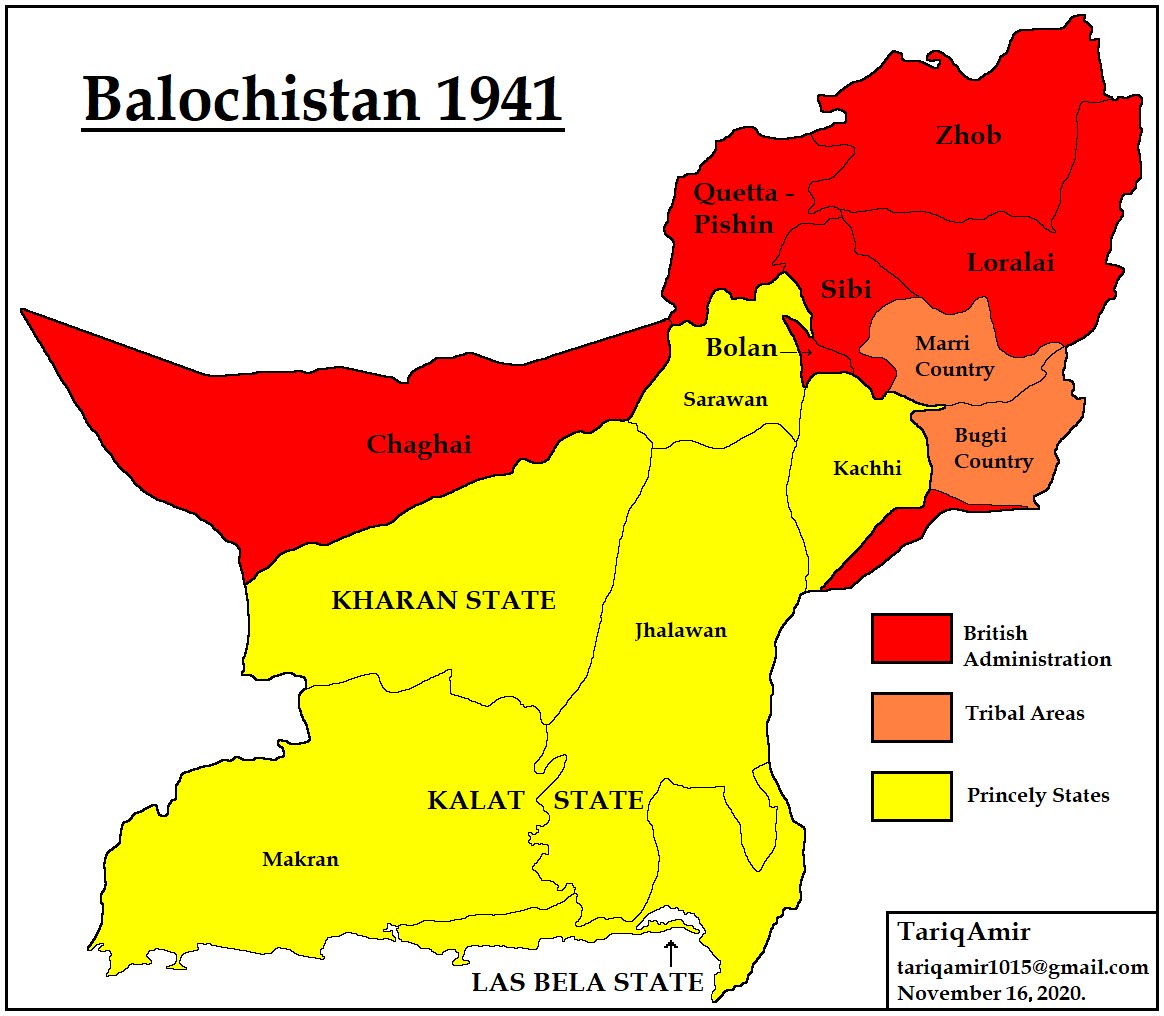
Balochistan – Administrative.

Balochistan – Political Map 1931.

Balochistan – Muslim Population, 1941.

Balochistan – Hindu Population, 1941.

Balochistan – Sikh Population, 1941.

Balochistan – Sikh Population, 1941.

Balochistan in British India.
|
Population Of Balochistan |
||||||||||
|
|
Ar. Km2 |
Population |
Muslims |
% |
Hindus |
% |
Sikhs |
% |
Christians |
% |
|
|
|
|
|
|
|
|
|
|
|
|
|
Baluchistan |
347,064 |
857,835 |
785,181 |
91.53 |
54,394 |
6.34 |
12,044 |
1.40 |
6,056 |
0.71 |
|
|
|
|
|
|
|
|
|
|
|
|
|
Districts |
141,040 |
501,631 |
438,980 |
87.51 |
44,623 |
8.90 |
11,918 |
2.38 |
6,002 |
1.20 |
|
Quetta-Pishin |
13,753 |
156,289 |
113,288 |
72.49 |
28,629 |
18.32 |
9,787 |
6.26 |
5,441 |
3.48 |
|
Loralai |
19,101 |
83,685 |
79,273 |
94.73 |
3,129 |
3.74 |
1,124 |
1.34 |
159 |
0.19 |
|
Zhob |
27,138 |
61,499 |
55,987 |
91.04 |
4,286 |
6.97 |
1,076 |
1.75 |
146 |
0.24 |
|
Bolan |
1,054 |
6,009 |
4,812 |
80.08 |
950 |
15.81 |
184 |
3.06 |
55 |
0.92 |
|
Chaghai |
50,321 |
29,950 |
27,864 |
93.04 |
1,204 |
4.02 |
181 |
0.60 |
1 |
0.00 |
|
Sibi: |
29,673 |
164,899 |
157,706 |
95.64 |
6,425 |
3.90 |
566 |
0.34 |
200 |
0.12 |
|
Administered Area |
10,723 |
106,787 |
99,875 |
93.53 |
6,144 |
5.75 |
566 |
0.53 |
200 |
0.19 |
|
Marri-Bugti Country |
18,951 |
58,112 |
57,831 |
99.52 |
281 |
0.48 |
– |
– |
– |
– |
|
|
|
|
|
|
|
|
|
|
|
|
|
States |
206,023 |
356,204 |
346,251 |
97.21 |
9,771 |
2.74 |
126 |
0.04 |
54 |
0.02 |
|
Kalat State: |
139,846 |
253,305 |
245,208 |
96.80 |
7,915 |
3.12 |
79 |
0.03 |
45 |
0.02 |
|
Sarawan |
12,914 |
28,270 |
27,592 |
97.60 |
566 |
2.00 |
61 |
0.22 |
25 |
0.09 |
|
Jhalawan |
53,051 |
52,272 |
52,194 |
99.85 |
77 |
0.15 |
– |
– |
– |
– |
|
Kacchis |
13,805 |
86,112 |
79,016 |
91.76 |
7,095 |
8.24 |
1 |
0.00 |
– |
– |
|
Makran |
60,077 |
86,651 |
86,406 |
99.72 |
177 |
0.20 |
17 |
0.02 |
20 |
0.02 |
|
Kharan State |
47,935 |
33,832 |
33,733 |
99.71 |
99 |
0.29 |
– |
– |
– |
– |
|
Las Bela State |
18,241 |
69,067 |
67,810 |
98.18 |
1,701 |
2.46 |
47 |
0.07 |
9 |
0.01 |
|
Population Of Balochistan |
|||||||||
|
|
Population |
Muslims |
% |
Hindus |
% |
Sikhs |
% |
Christians |
% |
|
|
|
|
|
|
|
|
|
|
|
|
Quetta Town |
36,430 |
19,056 |
52.31 |
12212 |
33.52 |
4,041 |
11.09 |
758 |
2.08 |
|
Quetta Cantt. |
28,006 |
8,879 |
31.70 |
11768 |
42.02 |
3,323 |
11.87 |
1,182 |
4.22 |
|
Pishin |
1,890 |
1,245 |
65.87 |
447 |
23.65 |
183 |
9.68 |
15 |
0.79 |
|
Chaman Town |
4,064 |
2,396 |
58.96 |
1286 |
31.64 |
194 |
4.77 |
176 |
4.33 |
|
Chaman Cantt. |
2,586 |
407 |
15.74 |
1616 |
62.49 |
503 |
19.45 |
24 |
0.93 |
|
Loralai Town |
3,419 |
2,055 |
60.11 |
971 |
28.40 |
330 |
9.65 |
63 |
1.84 |
|
Loralai Cantt. |
1,676 |
272 |
16.23 |
565 |
33.71 |
786 |
46.90 |
12 |
0.72 |
|
Ft. Sandeman Town |
5,986 |
4,087 |
68.28 |
1419 |
23.71 |
485 |
8.10 |
49 |
0.82 |
|
Ft. Sandeman Cantt. |
3,367 |
1,145 |
34.01 |
1573 |
46.72 |
601 |
17.85 |
12 |
0.36 |
|
Machh Town |
2,220 |
1,632 |
73.51 |
421 |
18.96 |
121 |
5.45 |
10 |
0.45 |
|
Sibi |
8,854 |
5,505 |
62.18 |
2814 |
31.78 |
362 |
4.09 |
95 |
1.07 |
|
Usta |
1,925 |
1,154 |
59.95 |
688 |
35.74 |
77 |
4.00 |
1 |
0.05 |
|
Kalat |
2,463 |
2,049 |
83.19 |
381 |
15.47 |
33 |
1.34 |
0 |
0.00 |
|
Mastung |
3,137 |
2,963 |
94.45 |
124 |
3.95 |
28 |
0.89 |
23 |
0.73 |
|
Pasni |
3,616 |
3,547 |
98.09 |
69 |
1.91 |
0 |
0.00 |
0 |
0.00 |
|
Panjgur |
473 |
416 |
87.95 |
45 |
9.51 |
9 |
1.90 |
0 |
0.00 |
|
Bela Town |
3,905 |
3,389 |
86.79 |
469 |
12.01 |
47 |
1.20 |
0 |
0.00 |
I hope anybody interested in the history of Balochistan and its demographics will find this post useful.
Tariq Amir
Doha – Qatar.
November 23, 2020.
For related posts, visit:
035. Partition Of Punjab in 1947
036. Muslim Population Of India: According To The Censuses Of 1941 and 2001
037. Partitions Of Bengal in 1905 and 1947
038. Demographics Of Jammu & Kashmir
054. Muslim Population Of India: According To The Census of 2011
127. Demographics of Sindh Province According to the Census of 1941
128. Demographics of North West Frontier Province According to the Census of 1941
129. The Disputed States I : Jammu & Kashmir (Demographics 1941)
130. The Disputed States II: Hyderabad State (Demographics 1941)