
128. Demographics of North West Frontier Province According to the Census of 1941
The British reached this part of India in the mid-nineteenth century, when they defeated the Sikh state of Lahore in 1849. At that time, Hazara, the Peshawar Valley, and the areas east of Waziristan were part of the Sikh state of Lahore. The British granted provincial status to these newly conquered areas of Punjab. But they did not stop there and continued to extend their influence northward and westward, finally concluding an agreement with Afghanistan in 1893, which defined the border between British India and Afghanistan. These newly acquired areas were either recognized as princely states or administered as tribal areas.
This arrangement remained in place until 1901, when the six trans-Indus districts of Punjab were carved out as a new province and given the name North-West Frontier Province (NWFP). After independence in 1947, the princely states and some tribal areas (such as Kohistan) were gradually merged into NWFP. However, the tribal agencies bordering Afghanistan were only merged in 2018. In the meantime, the province was renamed Khyber Pakhtunkhwa in 2010.
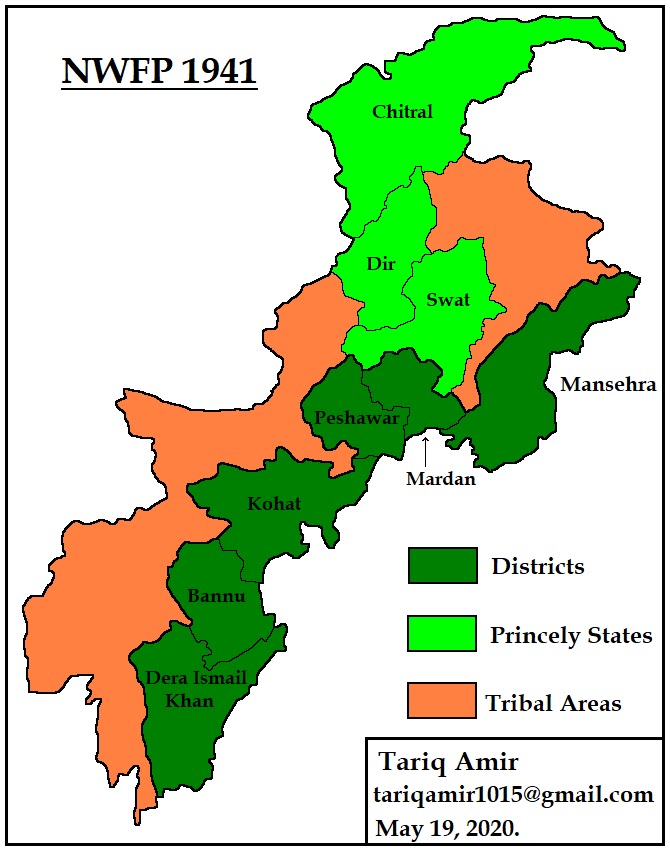
In this post, however, our focus is only on the census conducted in 1941 in the NWFP as it existed at that time, that is, the six districts of the province, excluding the princely states and tribal areas.
 |
|||||||||||||||||||||||||||||||||||||||||||||||||||||||||||||||||||||||||||||||||
| NWFP in 1941
First, you will find the percentage of the populations of all three major religious communities—Muslims, Hindus, and Sikhs, district-wise. The maps given below will explain the point further.
|
|||||||||||||||||||||||||||||||||||||||||||||||||||||||||||||||||||||||||||||||||
 |
| The Muslim population in 1941. (District Wise) |
 |
| The Hindu population in 1941. (District Wise) |
 |
| The Sikh population in 1941. (District Wise) |
The census report of NWFP, the year 1941, also provides the details of the population of the Tehsils (sub-districts). That provides a more detailed picture of the distribution of the populations of the three major religious communities.
|
No |
District/Tehsil |
Muslims |
% |
Hindus |
% |
Sikhs |
% |
|
1 |
Hazara |
756,004 |
94.95 |
30,267 |
3.80 |
9,220 |
1.16 |
|
i |
Mansehra |
237,306 |
97.58 |
4,910 |
2.02 |
965 |
0.41 |
|
ii |
Abbottabad |
284,228 |
92.13 |
17,558 |
5.69 |
6,035 |
1.96 |
|
iii |
Haripur |
178,545 |
95.04 |
7,278 |
3.87 |
2,011 |
1.07 |
|
iv |
Amb |
47,288 |
98.69 |
433 |
0.90 |
195 |
0.41 |
|
v |
Phulra |
8,637 |
98.83 |
88 |
1.01 |
14 |
0.16 |
|
2 |
Mardan |
483,575 |
95.47 |
10,677 |
2.11 |
11,838 |
2.34 |
|
i |
Mardan |
281,161 |
93.91 |
8,709 |
2.91 |
9,091 |
3.04 |
|
ii |
Swabi |
202,414 |
97.71 |
1,968 |
0.95 |
2,747 |
1.33 |
|
3 |
Peshawar |
769,589 |
90.35 |
51,212 |
6.01 |
24,030 |
2.82 |
|
i |
Peshawar |
335,871 |
86.27 |
33,551 |
8.62 |
15,454 |
3.97 |
|
ii |
Nowshera |
194,084 |
88.92 |
15,128 |
6.93 |
6,636 |
3.04 |
|
iii |
Charsadda |
239,634 |
98.11 |
2,533 |
1.04 |
1,940 |
0.79 |
|
4 |
Kohat |
266,244 |
91.99 |
17,527 |
6.06 |
4,349 |
1.50 |
|
i |
Kohat |
100,868 |
88.01 |
9,156 |
7.99 |
3,613 |
3.15 |
|
ii |
Teri |
110,146 |
97.73 |
2,462 |
2.18 |
86 |
0.08 |
|
iii |
Hangu |
55,210 |
88.97 |
5,909 |
9.52 |
650 |
1.05 |
|
5 |
Bannu |
257,648 |
87.06 |
31,471 |
10.63 |
6,112 |
2.07 |
|
i |
Bannu |
157,097 |
83.74 |
24,517 |
13.07 |
5,285 |
2.82 |
|
ii |
Marwat |
100,551 |
92.82 |
6,954 |
6.42 |
827 |
0.76 |
|
6 |
D. I. Khan |
255,757 |
85.79 |
39,157 |
13.13 |
2,390 |
0.80 |
|
i |
D. I. Khan |
155,100 |
82.68 |
30,065 |
16.03 |
1,740 |
0.93 |
|
ii |
Tank |
49,847 |
89.55 |
5,279 |
9.48 |
401 |
0.72 |
|
iii |
Kulachi |
50,810 |
92.58 |
3,823 |
6.97 |
249 |
0.45 |
 |
| The Muslim population in 1941. (Tehsil Wise) |
 |
| The Hindu population in 1941. (Tehsil Wise) |
 |
| The Sikh population in 1941. (Tehsil Wise) |
The
data given below shows the population of religious communities in
the towns, cities and cantonments in the province
|
City |
Total |
Muslims |
% |
Hindus |
% |
Sikh |
% |
|
Abbottabad C |
13,866 |
3,331 |
24.02 |
8922 |
64.34 |
1,205 |
8.69 |
|
Abbottabad M |
13,558 |
8,861 |
65.36 |
2964 |
21.86 |
1,475 |
10.88 |
|
Haripur |
9,322 |
5,174 |
55.50 |
3113 |
33.39 |
1,035 |
11.10 |
|
Baffa |
7,988 |
7,166 |
89.71 |
735 |
9.20 |
81 |
1.01 |
|
Nawanshehr |
6,414 |
5,075 |
79.12 |
1030 |
16.06 |
309 |
4.82 |
|
Kot Najibullah |
5,315 |
4,228 |
79.55 |
929 |
17.48 |
156 |
2.94 |
|
Mansehra |
10,217 |
8,141 |
79.68 |
1699 |
16.63 |
375 |
3.67 |
|
Mardan M |
39,200 |
28,994 |
73.96 |
4700 |
11.99 |
5,368 |
13.69 |
|
Mardan C |
3,294 |
1,307 |
39.68 |
1151 |
34.94 |
646 |
19.61 |
|
Peshawar M |
13,0967 |
104,650 |
79.91 |
16546 |
12.63 |
8,554 |
6.53 |
|
Peshwar C |
42,453 |
18,322 |
43.16 |
15084 |
35.53 |
5,691 |
13.41 |
|
Nowshera NA |
17,491 |
16,876 |
96.48 |
379 |
2.17 |
236 |
1.35 |
|
Nowshera C |
26,531 |
11,256 |
42.43 |
9452 |
35.63 |
4,017 |
15.14 |
|
Risalpur C |
9,007 |
3,506 |
38.93 |
3937 |
43.71 |
1,024 |
11.37 |
|
Cherat C |
337 |
270 |
80.12 |
30 |
8.90 |
25 |
7.42 |
|
Charsadda |
16,845 |
15,747 |
93.48 |
745 |
4.42 |
294 |
1.75 |
|
Utmanzai |
10,129 |
9,768 |
96.44 |
182 |
1.80 |
171 |
1.69 |
|
Tangi |
12,906 |
12,456 |
96.51 |
444 |
3.44 |
2 |
0.02 |
|
Parang |
13,496 |
13,494 |
99.99 |
2 |
0.01 |
– |
– |
|
Kohat M |
34,316 |
27,868 |
81.21 |
4632 |
13.50 |
1,546 |
4.51 |
|
Kohat C |
10,706 |
4,243 |
39.63 |
3618 |
33.79 |
2,016 |
18.83 |
|
Bannu M |
3,3210 |
8,507 |
25.62 |
20773 |
62.55 |
3,583 |
10.79 |
|
Bannu C |
5,294 |
2,189 |
41.35 |
1442 |
27.24 |
1,311 |
24.76 |
|
Lakki NA |
10,141 |
8,010 |
78.99 |
3710 |
36.58 |
548 |
5.40 |
|
D. I. Khan M |
49,238 |
25,443 |
51.67 |
22315 |
45.32 |
1,204 |
2.45 |
|
D. I. Khan C |
2,068 |
981 |
47.44 |
500 |
24.18 |
238 |
11.51 |
|
Kulachi |
8,838 |
6,610 |
74.79 |
2092 |
23.67 |
138 |
1.56 |
|
Tank |
9,089 |
5,531 |
60.85 |
3296 |
36.26 |
181 |
1.99 |
Area of the administrative units of NWFP:
|
No |
District/Tehsil |
Area Km2 |
|
1 |
Hazara |
7,793 |
|
Mansehra |
3,753 |
|
|
Abbottabad |
1,810 |
|
|
Haripur |
1,686 |
|
|
Amb |
451 |
|
|
Phulra |
93 |
|
|
2 |
Mardan |
2,833 |
|
Mardan |
1,614 |
|
|
Swabi |
1,220 |
|
|
3 |
Peshawar |
3,996 |
|
Peshawar |
1,178 |
|
|
Nowshera |
1,826 |
|
|
Charsadda |
992 |
|
|
4 |
Kohat |
7,001 |
|
Kohat |
1,930 |
|
|
Teri |
3,970 |
|
|
Hangu |
1,101 |
|
|
5 |
Bannu |
4,398 |
|
Bannu |
1,197 |
|
|
Marwat |
3,201 |
|
|
6 |
D. I. Khan |
8,990 |
|
D. I. Khan |
4,496 |
|
|
Tank |
1,673 |
|
|
Kulachi |
2,820 |
|
|
|
Total |
35,051 |
 |
| Cover of the Census Report. |
I took the
data of the population from the official report for the census of NWFP in 1941. I
hope this post will be useful to people who have some interest in the
demographics of this region before the partition. Your comments are very valuable and helpful in improving this work.
Tariq Amir
May 20, 2020.
Doha – Qatar.
For related posts. visit:
035. Partition Of Punjab in 1947
036. Muslim Population Of India: According To The Censuses Of 1941 and 2001
037. Partitions Of Bengal in 1905 and 1947
038. Demographics Of Jammu & Kashmir
054. Muslim Population Of India: According To The Census of 2011
127. Demographics of Sindh Province According to the Census of 1941
129 – The Disputed States I : Jammu & Kashmir (Demographics 1941)
130 – The Disputed States II: Hyderabad State (Demographics 1941)
133 – Demographics of Balochistan Province According the Census of 1941 (Religions)